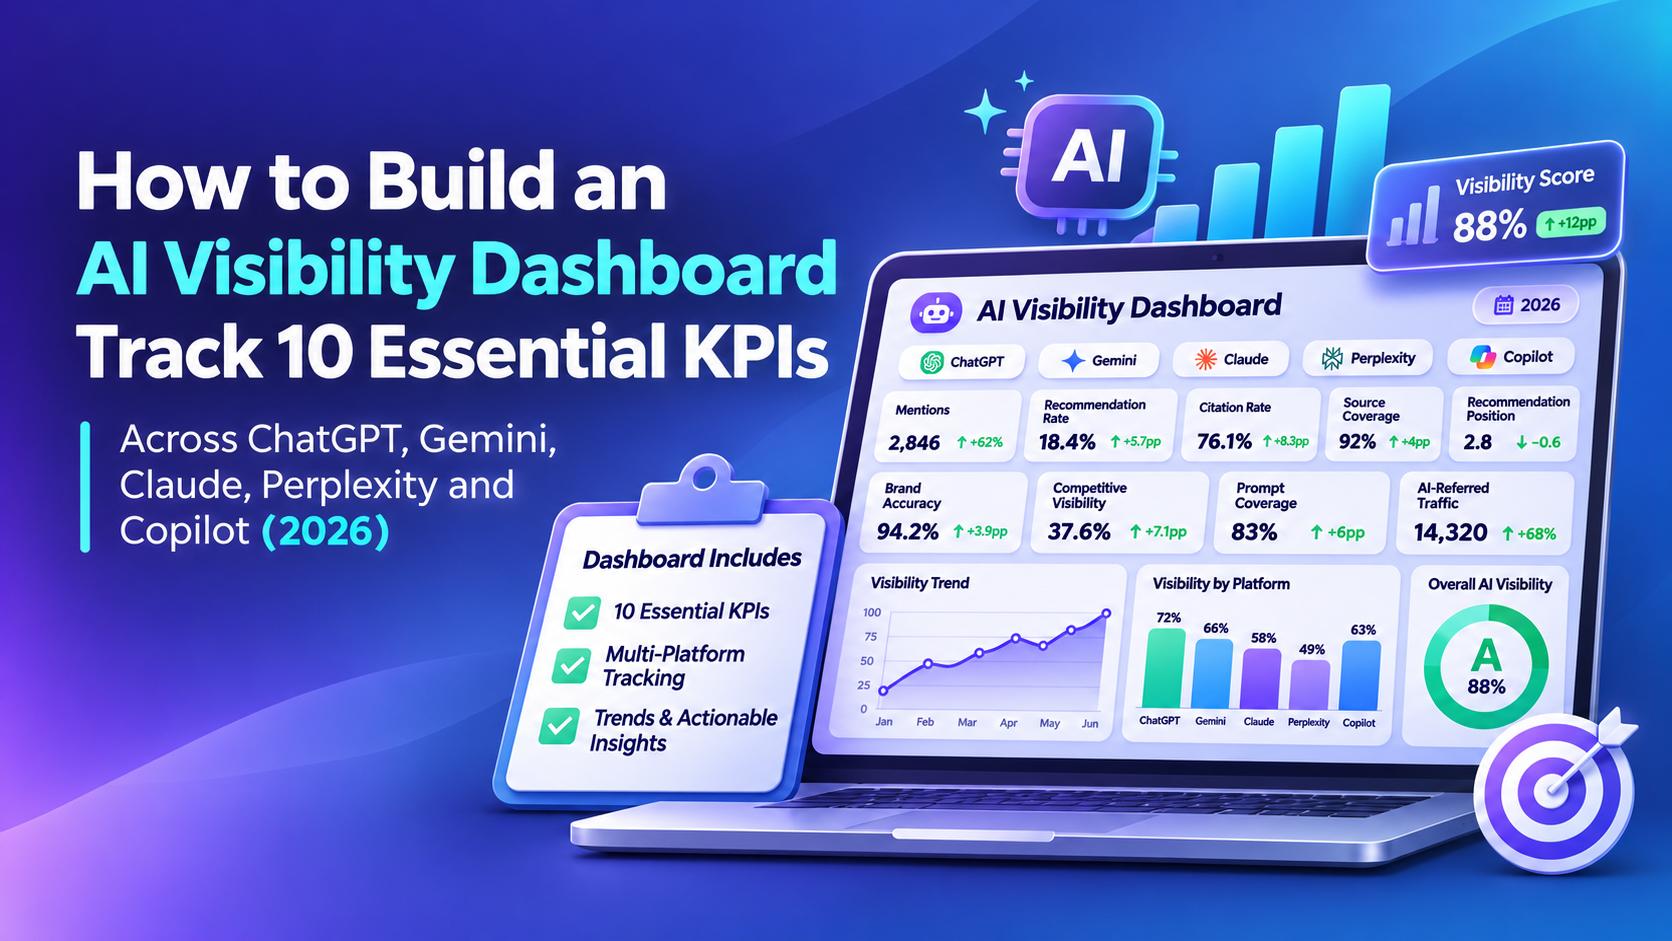
How to Build an AI Visibility Dashboard: Track 10 Essential KPIs Across ChatGPT, Gemini, Claude, Perplexity and Copilot (2026)
Updated November 16, 2026 | AI Visibility Directory | Practical US business guide
A conventional marketing dashboard reports impressions, clicks, leads, and conversions. An AI visibility dashboard asks an additional question: when customers ask AI assistants for information or recommendations in your market, does your brand appear, how is it described, and which sources support the answer?
For an American software company, law firm, manufacturer, medical practice, or local service provider, those questions cannot be answered reliably by taking one screenshot of ChatGPT. A useful dashboard has a fixed prompt library, a documented collection method, auditable response records, transparent denominators, and separate views for each platform.
This tutorial shows how to build that system without assuming that AI assistants expose an official universal brand-ranking or impression metric. It covers ten KPIs, the underlying data model, worked calculations, quality assurance, implementation options, a dashboard layout, and a 30-day launch plan.
Important: The figures below are fictional demonstrations. Your measured AI visibility is limited to the prompts, geography, accounts, dates, and product experiences that you actually test. No dashboard can observe every private AI conversation.
1. What an AI visibility dashboard should answer
An effective dashboard answers five business questions:
- Discovery: Does the assistant mention your brand when the user has not specified it?
- Selection: Does the assistant actually recommend your business, rather than merely name it?
- Competition: Which rivals appear alongside or instead of your brand?
- Evidence and accuracy: Are your pages cited, and does the answer describe your company correctly?
- Change: Are results improving within the same tested prompt cohort over time?
The critical operating principle is comparison under consistent conditions. Keep the prompt panel, language, geographic focus, audience, scoring rules, and sampling schedule stable. If you change them, version the test and avoid interpreting a methodology change as a marketing improvement.
An AI assistant response is a sample, not an exhaustive search-volume measurement. A company may be recommended in one chat and absent in another because assistants vary by context, retrieval availability, model configuration, personalization, and other factors. Therefore report sample counts, not just percentages.
2. The ten essential AI visibility KPIs
Use the following definitions as an internal measurement standard, not as universal vendor specifications. Each KPI's denominator must be displayed in the dashboard.
| # | KPI | Calculation | Business question |
|---|---|---|---|
| 1 | AI Brand Mention Rate | Eligible responses mentioning your brand / all eligible responses × 100 | Do we appear at all? |
| 2 | AI Recommendation Rate | Eligible commercial-intent responses explicitly recommending your brand / all eligible commercial-intent responses × 100 | Are we suggested as a solution? |
| 3 | Competitive Mention Share | Your brand-presences / all tracked-brand presences × 100 | What portion of observed brand exposure is ours? |
| 4 | AI Citation Coverage | Eligible answers citing an owned domain / all eligible answers × 100 | Do answers reference our website? |
| 5 | AI Source Coverage | Distinct priority website pages cited / eligible priority pages × 100 | How broadly are our pages represented? |
| 6 | AI Citation Accuracy | Citations correctly supporting their associated claims / verifiable audited citation instances × 100 | Are citations actually relevant and sound? |
| 7 | AI Brand Accuracy | Factually accurate, verifiable claims about brand / all verifiable audited brand claims × 100 | Is the AI telling the truth about us? |
| 8 | Net AI Brand Sentiment | (Positive brand mentions − negative brand mentions) / all classifiable brand mentions × 100 | Is the overall description favorable? |
| 9 | Top-3 Recommendation Opportunity Rate | Eligible recommendation answers with your brand explicitly ranked 1–3 / all eligible recommendation opportunities × 100 | How often do we earn a top-three slot? |
| 10 | AI Citation Diversity | Number of distinct third-party domains cited in monitored category answers; also show top-three citation concentration | Is evidence drawn from a broad range of sources? |
Label KPI 10 carefully: It concerns the diversity of the sources you observe in the answers, not necessarily the diversity of websites recommending your brand. If you want brand-specific third-party source diversity, restrict the set to citations supporting statements about your brand and show that filter explicitly.
For KPI 8, mixed and neutral mentions contribute zero to the numerator; the denominator includes positive, negative, neutral, and mixed mentions that can be classified. Responses without a brand mention are excluded. This rule ensures a score between −100 and +100. Different sentiment systems may implement a different convention.
For KPI 9, an ordered list must unambiguously convey order. Do not assume that the first company in a bulleted, unranked list is ranked #1. Track an additional Top-3 Placement Rate Among Ordered Appearances if useful; that metric has a different denominator and must not be substituted for opportunity rate.
For KPI 3, a response may mention multiple tracked brands. The total number of brand-presences can exceed the number of responses. Competitive mention share is not the same as the fraction of all responses mentioning your brand.
For KPI 6, distinguish invalid links, outdated sources, irrelevant citations, and unverifiable claims. Include the separate unverifiable share; excluding unverifiable items from accuracy calculations without disclosing them can make a report misleading.
3. Select the platforms and experiences deliberately
A simple five-platform starting scope is:
- ChatGPT: Define whether the test is an ordinary chat, a web-search-enabled response, or another experience. Record the interface and whether retrieval occurred.
- Google Gemini: Define whether the test is Gemini Apps and record retrieval/source displays when present. Do not automatically merge results with Google AI Overviews or AI Mode, which are Google Search experiences.
- Claude: Record the model/experience and whether web search was enabled or used. Citations may not appear in every answer.
- Perplexity: Record the selected search mode, model option when visible, and cited sources.
- Microsoft Copilot: Distinguish a consumer Copilot answer from other Microsoft products. Bing AI Performance data is a separate, aggregated publisher reporting source.
Use a platform-experience identifier, not merely a brand name. A prompt collected using a web-grounded experience is not directly comparable to an answer generated without retrieval. Document product changes rather than hiding them inside an average.
Official reporting versus controlled prompt tests
Two important complementary sources are:
Bing Webmaster Tools AI Performance: Microsoft documents aggregated visible citation activity across supported Copilot, Bing-generated summaries, and selected partner surfaces, including cited pages and grounding-query groupings. The report is not a complete log of responses, does not report a ranking position in an individual answer, and should not be treated as a direct denominator for your manual prompt-panel citation coverage. Source: Bing Webmaster Tools AI Performance.
Google Search Console: Google's documentation says that AI Overviews and AI Mode are included within overall Search Console Web search reporting. This is useful for search performance and traffic analysis, but is not equivalent to a universal Gemini brand-mention dashboard or a prompt-level recommendation dataset. Source: Google Search Central — AI features.
Best practice: Put independently sampled response KPIs in one dashboard section and native publisher-reported metrics in another, with an explicit data source label. Never add Bing citation events to manually observed ChatGPT citations and call the sum an official cross-platform exposure count.
4. Build a balanced prompt library
Start with 40 prompts relevant to the US market, divided among five intent groups:
| Intent segment | Example prompt | Suggested prompts |
|---|---|---|
| Category discovery | “What are good [category] providers for a US business?” | 8 |
| Shortlist / comparison | “Compare [brand-agnostic alternatives] for a small team.” | 8 |
| Problem / solution | “How do I solve [customer problem], and which providers help?” | 8 |
| Research / trust | “Which providers have experience with [industry requirement]?” | 8 |
| Local / industry-specific | “Which providers serve [US state or industry segment]?” | 8 |
| Total | 40 |
Avoid a test set made exclusively of your company name: branded prompts largely measure name recognition in a direct query, not spontaneous discovery. Keep unbranded prompts as the primary visibility panel, and maintain a secondary branded panel for factual accuracy, support questions, and reputation checks.
Save each prompt with an immutable prompt_id, exact text, intent class, target geography, target buyer type, language, and version. Build an explicit list of tracked competitors. Include brands that genuinely compete for the target query, not just brands you prefer to compare with.
Example sampling schedule
With 40 prompts × five platforms × two repeated runs, you collect 400 responses per measurement wave. Run a weekly wave at a consistent time window; if resources are limited, start with monthly waves. Repeated runs are not independent observations of the overall population, but they help show variability in the test setup.
If one platform fails or a prompt cannot be executed, record that attempt as missing rather than silently removing it or treating it as “no brand mention.” Retain a separate completion rate for operational QA.
5. Define a clear response-level classification rubric
Classify every sampled answer into these fields before calculating KPIs:
- Mentioned: Does a normalized entity match refer to the business? Handle abbreviations and similarly named companies carefully.
- Recommended: Does the response actively suggest choosing, considering, contacting, or evaluating the business as a solution to the user request? A neutral mention in a list of examples is not automatically an endorsement.
- Recommendation position: Numeric rank only for a clearly ordered list; otherwise
unordered,single recommendation,not present, orambiguous. - Cited: Does a visible citation explicitly link to the owned domain? Capture canonical page URLs and source types.
- Accuracy: Extract verifiable factual claims; assess them against current primary evidence and store the reference URL.
- Sentiment: Positive, neutral, negative, mixed, or not applicable; distinguish tone from factual correctness.
- Competitor presences: Record each normalized tracked rival found in the answer, even if several appear together.
- Evidence quality: Record whether citations open, are current, and actually support associated claims.
Use two reviewers for a subset of records, especially recommendation and sentiment judgments. Maintain an adjudication log for disagreements. An automatic labeler can accelerate review, but do not treat its labels as ground truth without QA.
6. Design the underlying data structure
You do not need enterprise analytics software to start. A relational database, CSV files, or even a carefully structured spreadsheet can hold the core records.
Table A — prompts
prompt_id, prompt_version, prompt_text, intent, geography, industry, buyer_persona, active_from, active_to
Table B — response samples
response_id, wave_id, prompt_id, platform, experience, model_or_mode, collected_at_utc, run_number, status, response_text, response_hash, reviewer, review_status
Table C — brand labels
response_id, brand_id, mentioned, recommended, rank_type, rank_number, sentiment, labeling_version
Store one row per response–brand pair. This handles multiple brands appearing in one response without duplicating the response itself.
Table D — citations
citation_id, response_id, cited_url, canonical_domain, normalized_url, associated_claim_id, accessible, supportive, freshness_status, review_status
Table E — factual claims
claim_id, response_id, brand_id, claim_text, evidence_url, evaluation_status, severity, reviewed_at
Table F — snapshots
wave_id, measurement_start, measurement_end, prompt_set_version, scoring_version, eligible_count, missing_count, data_quality_notes
Use foreign keys or equivalent integrity checks. Store the underlying answer snapshots, not just aggregate scores, so you can audit and reproduce a KPI later. Follow platform terms, minimize unnecessary personal information, and retain only data needed for measurement.
7. Calculate a dashboard from a worked 400-response sample
Assume 40 prompts are tested in each of five platforms, with two runs per prompt: 80 eligible responses per platform, or 400 total. For this demonstration, every response qualifies for the brand-mention analysis; a smaller subset may qualify for other metrics.
| Platform | Eligible answers | Your brand mentioned | Mention rate | Your brand recommended | Recommendation rate* |
|---|---|---|---|---|---|
| ChatGPT | 80 | 36 | 45.0% | 20 | 25.0% |
| Gemini | 80 | 24 | 30.0% | 12 | 15.0% |
| Claude | 80 | 20 | 25.0% | 8 | 10.0% |
| Perplexity | 80 | 32 | 40.0% | 16 | 20.0% |
| Copilot | 80 | 28 | 35.0% | 14 | 17.5% |
| Total | 400 | 140 | 35.0% | 70 | 17.5% |
For this simplified example only, all 80 prompts per platform are defined as eligible commercial recommendation opportunities. In a real mixed-intent library, calculate recommendation rate using only eligible commercial-intent responses, and state that denominator in every platform row.
Total mention rate = 140 ÷ 400 × 100 = 35.0%.
Total recommendation rate = 70 ÷ 400 × 100 = 17.5% under the stated all-commercial eligibility assumption.
If platforms have different eligible sample sizes, the overall percentage should be based on the sums of numerators and denominators rather than the unweighted average of platform percentages. An unweighted average can be shown as a separate equal-platform index, but must be labeled as such.
An additional sample of the remaining KPIs
Suppose the same audit determines:
- Competitive mention share: Your brand accounts for 140 of 500 tracked-brand presences = 28.0%. This denominator permits multiple brands in one answer.
- Citation coverage: 68 of 400 answers cite your domain = 17.0%.
- Source coverage: 15 of 60 preselected priority pages were cited = 25.0%.
- Citation accuracy: 54 of 60 verifiable citation-claim pairs were supported = 90.0%, with an additional 8 unverifiable cases tracked separately.
- Brand accuracy: 180 of 200 verifiable brand claims were accurate = 90.0%, with 15 unverifiable claims reported separately.
- Sentiment: Across 140 classifiable brand mentions, 70 positive, 35 neutral, 21 negative, and 14 mixed gives (70 − 21) ÷ 140 × 100 = +35.0.
- Top-3 recommendation opportunity rate: 30 of 400 eligible recommendation opportunities show your brand explicitly ranked 1–3 = 7.5%. This is not the same as its top-three share among ordered appearances.
- Citation diversity: Category answers cite 24 distinct third-party domains. The top three generate 90 of 200 third-party citation instances = 45.0% top-three concentration.
These numbers are illustrative and do not claim any particular AI platform's real performance.
8. Create a useful dashboard layout
Arrange the report into five sections, from executive interpretation to auditable evidence.
Section A — Executive scorecard
Show six prominent tiles: Brand Mention Rate, Recommendation Rate, Competitive Mention Share, Citation Coverage, Brand Accuracy, and Top-3 Opportunity Rate. Give each tile its numerator, denominator, latest period, previous comparable period, and change in percentage points.
Display the other four metrics immediately below or on a second scorecard row. Do not reduce all ten to an unexplained composite “AI visibility score.” If stakeholders insist on a single index, publish the component weights and warn that the index is a management convention, not an AI-system ranking.
Section B — Platform comparison
Use a five-row matrix for ChatGPT, Gemini, Claude, Perplexity, and Copilot. Columns should include eligible samples, mention rate, recommendation rate, citation coverage, fact accuracy, and QA completion. Keep platform-experience filters accessible.
A bar chart can compare mention and recommendation rates, while a line chart shows weekly trends within the same experience. Place a warning when the model, prompt set, or measurement method changes.
Section C — Competitor comparison
Show brand-presence counts, recommendation counts, competitive mention share, and where possible a side-by-side category/intent breakdown. Your company can lead in one high-intent segment while trailing overall. That distinction is strategically useful.
Never compare a competitor's directly branded prompts with your company's unbranded prompts. The prompt exposure must be symmetrical.
Section D — Evidence and content
Show cited page URLs, pages never cited in the sample, unique third-party source domains, top-concentration measures, and any factually incorrect brand assertions that need review. Prioritize serious misinformation over changes in sentiment alone.
Section E — Audit and methodology
Show the prompt library version, sampling dates, platform modes, missing-data rate, label-review completion, and formula definitions. Add a downloadable response-level evidence table with sensitive information removed. This is what turns a marketing chart into a defensible measurement system.
9. Build it in three implementation tiers
Tier 1 — Spreadsheet MVP
Use five sheets: Prompts, Responses, Labels, Citations, and Dashboard. Add another Claims sheet if factual accuracy is an immediate priority. Import one row per response into Responses, and use response_id to join labels and evidence. Pivot by platform and wave; calculate the KPI numerators from Boolean flags.
This is ideal for a small US business validating whether the monitoring process offers actionable insights. Its main risk is manual classification inconsistency, not technical complexity.
Tier 2 — Database plus BI dashboard
Use PostgreSQL or MySQL, a small scheduled collection service where permitted, and a reporting layer such as Power BI, Metabase, or Looker Studio. Make wave_id, prompt_id, and response_id unique and immutable. Keep the raw output available for authorized reviewers.
In SQL, use distinct response IDs for response-level rates to prevent inflated counts when one response has multiple brand or citation rows. For instance, compute response eligibility first, then left-join preaggregated brand flags before grouping by platform.
Tier 3 — Commercial AI visibility monitoring platform
If staffing or scale makes DIY collection impractical, evaluate specialist US-based platforms and agencies. Your directory includes Profound, Evertune, Scrunch AI, Brandlight, Conductor, and seoClarity.
Before buying, ask vendors for their prompt sampling method, model/mode coverage, geography controls, classification rules, historical exports, competitor matching method, citation definitions, and visibility into sample sizes. A polished dashboard cannot compensate for a poorly explained metric.
For implementation help, review the US agency listings for WebFX, Omniscient Digital, iPullRank, and First Page Sage. Compare the actual service scope and reporting deliverables rather than presuming identical capabilities.
10. Add data quality and governance before launch
AI answers change. Without a QA system, dashboard trends can reflect labeling errors, outages, or sampling drift.
Introduce the following safeguards:
- Prompt-set versioning: A new question set is a new measurement cohort, not a continuation of the old trend line.
- Response preservation: Store response timestamps, modes, and complete content or approved excerpts needed for audit.
- Entity matching: Maintain aliases and disambiguation rules to prevent false brand matches.
- Citation deduplication: Record citation instances separately from unique domains and unique pages.
- Uncertainty flags: Mark unverifiable facts, missing responses, ambiguous recommendations, and inaccessible citations.
- Human review: Double-label an initial subset, calculate disagreement rates, and publish the adjudication standard.
- Geographic consistency: Keep US-market context stable; do not mix responses in different regions without labeling them.
- Change annotations: Record platform/model changes and major content or positioning updates.
- Security: Limit access to commercially sensitive monitoring data and avoid collecting personal chat histories without authorization.
Do not imply a causal lift because a score rises after a website edit. A time series can identify correlations, but causal attribution requires a stronger experimental design and control for platform changes.
11. A 30-day dashboard implementation plan
Days 1–5: Define goals and measurement rules
List the business questions, select five to ten direct competitors, define your ten KPI formulas, and decide how to classify a recommendation. Agree on which segments count as eligible opportunities. Freeze Version 1 of the prompt library and the US-market scope.
Days 6–10: Build the data capture workflow
Set up the six core tables or spreadsheet tabs. Capture a pilot sample from each platform, including mode, time, prompt, model where disclosed, response text, and citations. Verify that the response IDs and deduplicated page URLs behave correctly.
Days 11–15: Run the baseline
Collect the first complete measurement wave. Assign labels. Manually audit a stratified subset for recommendation judgments, source support, claim accuracy, and sentiment. Document any missing data and coverage limitations.
Days 16–20: Assemble the dashboard
Build the executive tiles, platform matrix, competitor view, citation evidence table, and methodology panel. Test formulas against hand calculations from a small record sample. Check that filters change numerators and denominators together.
Days 21–25: Turn results into actions
Identify three specific questions where rivals are repeatedly recommended and your brand is absent. Review the cited information sources, relevant site pages, business profile accuracy, and your content coverage. Assign owners and hypotheses to proposed fixes.
Days 26–30: Publish internally and schedule the next wave
Create a short executive interpretation with sample counts, biggest opportunities, limitations, and next actions. Record the baseline permanently. Schedule follow-up measurements using the same test design to make trends interpretable.
12. How to interpret the dashboard without overclaiming
A high mention rate but low recommendation rate indicates awareness without selection within the tested prompts. Review whether the assistant presents your company as an example rather than a fit for the buyer's criteria. This does not establish why the system behaved that way.
A high recommendation rate paired with low citation coverage may mean the answer recommends your business without linking to your owned site. That is a distinct distribution problem from being absent entirely. Verify whether citations appear in the particular assistant experience before drawing conclusions.
A low accuracy rate with high mentions is a potential trust risk. Correct your owned information, investigate stale third-party claims, and document verifiable facts. The effect on future assistant answers may be delayed or uncertain.
High third-party citation concentration can reveal that a few publications dominate the observed answer evidence. It does not prove those sources cause your brand's recommendation. Use it to identify where further research and outreach may be warranted.
A sudden cross-platform rise is not necessarily a market-wide change. Check whether prompts, models, citation interface, sampling availability, and entity-matching rules remained stable. For decision-making, prioritize repeated movement across consistent waves over one-off observations.
13. Common mistakes to avoid
Mistake 1: Reporting percentages without denominators. “50% visibility” from six answers is not the same as 50% from 600. Show eligible N and date range for every tile.
Mistake 2: Combining incompatible native metrics. Bing's publisher citation counts and your own ChatGPT response-sample coverage have different observation units and cannot be added directly.
Mistake 3: Treating every brand mention as an endorsement. Define recommendation intent independently from whether a company appears anywhere in the response.
Mistake 4: Confusing source citations with brand citations. A source URL may support a general claim or a competitor, not necessarily your company.
Mistake 5: Hiding unranked answers. Unordered recommendations and narrative text should be classified, not forced into ranks 1, 2, and 3.
Mistake 6: Using a changing prompt set for trend lines. Version prompt panels and keep a stable cohort for comparable analysis.
Mistake 7: Treating tool-generated sentiment as truth. Audit subjective labels, especially sarcasm, negation, and mixed reviews.
Mistake 8: Ignoring competitive question intent. A recommendation for enterprise buyers is different from one for a US small-business owner; report segments separately.
Mistake 9: Chasing a single global score. Keep the ten interpretable KPIs visible rather than optimizing a proprietary index that hides tradeoffs.
Mistake 10: Claiming guaranteed AI placement. No responsible measurement design can promise inclusion or a particular ranking across future assistant responses.
14. Frequently asked questions
What is an AI visibility dashboard?
A reporting system that tracks how a brand appears in sampled AI-generated answers, including mentions, recommendations, competitor appearances, citations, factual accuracy, sentiment, and ordering. Its outputs are estimates for a specified test cohort rather than direct logs of all user conversations.
Which AI visibility KPIs should a small business start with?
Begin with mention rate, recommendation rate, competitive mention share, citation coverage, and brand accuracy. Add recommendation rank, sentiment, and source analysis once your labeling process is reliable.
How often should I update the dashboard?
Monthly is a manageable starting cadence; weekly is useful when you have sufficient collection capacity and meaningful decisions tied to changes. Keep the cohort consistent and preserve baseline snapshots.
Can Google Analytics measure AI brand mentions?
Not directly. Analytics may show website visits or conversions attributable to identifiable referrers, subject to attribution limitations, but it cannot observe every response mentioning your brand inside an assistant.
Can Google Search Console report Gemini recommendation rate?
No universal brand recommendation-rate report is described in the Google AI features documentation. Search Console reports Search performance, including traffic from supported AI search features within the Web search type; that is different from direct sampling of Gemini recommendations.
Can Bing Webmaster Tools show my ranking in Copilot answers?
Microsoft's AI Performance documentation expressly distinguishes citation activity from ranking or placement in an individual answer. Use your own audited answer samples if your project needs recommendation positions.
Is AI Share of Voice the same as mention rate?
No. Mention rate divides your brand mentions by eligible answers. Competitive mention share divides your brand presences by all tracked-brand presences in the same sampled answers. Multiple brands can appear in one answer.
Can I compare scores from two monitoring vendors?
Only after comparing prompt panels, geographic settings, platforms/modes, model versions, frequency, sample sizes, brand matching, recommendation rules, and denominator definitions. Superficially identical metric names do not guarantee equivalent calculations.
Should I merge Google AI Overviews with Gemini?
Usually not for the baseline dashboard. Google AI Overviews and AI Mode are Google Search experiences, while Gemini is another product experience. Analyze them as distinct surfaces unless your report explicitly defines and justifies a combined view.
What is the best first dashboard visualization?
A platform matrix showing mentions, recommendations, citations, and eligible sample counts next to an executive trend scorecard. These immediately expose whether an overall average conceals a weak-performing platform.
How do I know whether an improvement worked?
Repeat the same prompt cohort under comparable conditions, track changes over multiple waves, and investigate other simultaneous changes. Treat the result as monitoring evidence rather than proof of causality unless you have a suitable experimental design.
15. Official documentation and further reading
- Microsoft: AI Performance in Bing Webmaster Tools — official definitions of citation counts, cited pages, and data limitations.
- Microsoft: Introducing AI Performance, February 2026 — original publisher reporting announcement.
- Microsoft: AI Visibility Insights, June 2026 — intent, topic, comparison, and citation-share reporting expansions.
- Google Search Central: AI Features and Your Website — eligibility and performance-reporting scope for Google AI search features.
- Google Search Central: Optimizing for Generative AI Features — Google's official guidance for site owners.
Continue with the AI Visibility Directory KPI series
Build on this tutorial with our guides to AI brand mention rate versus recommendation rate, AI Share of Voice, AI Citation Coverage, AI Brand Accuracy, AI Brand Sentiment, AI Platform Comparison, AI Competitive Visibility, and AI Recommendation Position.
Bottom line: A useful AI visibility dashboard does not manufacture certainty. It tells your team which brands are being mentioned and recommended in a controlled sample, which evidence is appearing, whether statements are correct, and where to investigate next. Start with transparent metrics and auditable samples; improve the sophistication only after the baseline is trustworthy.