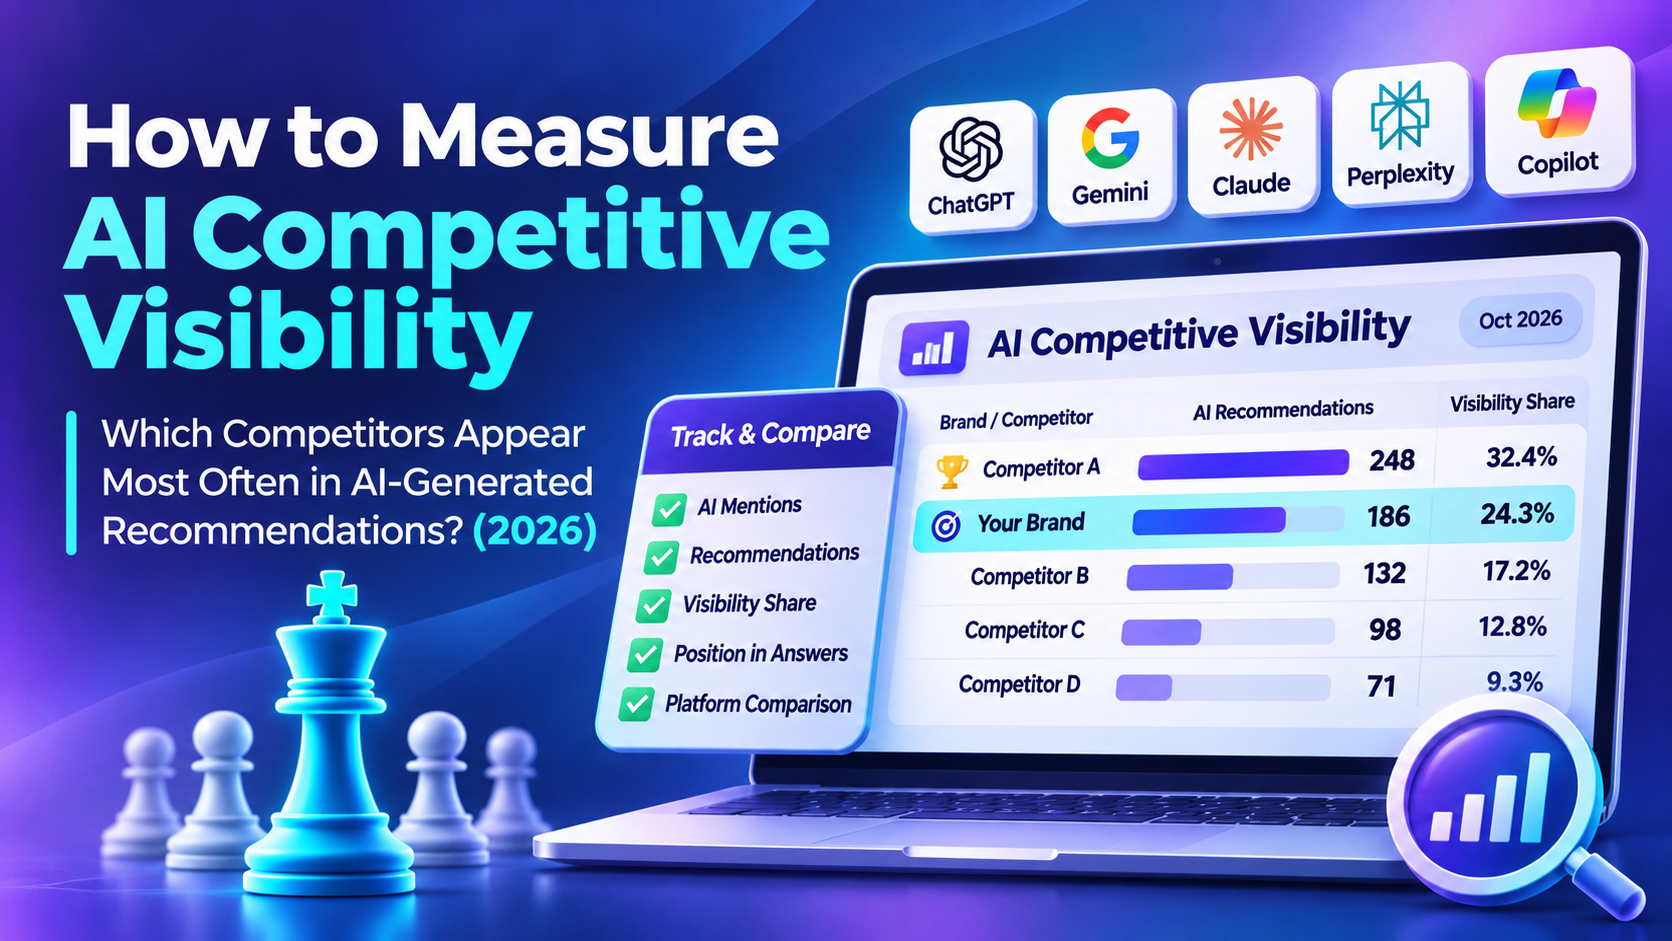
How to Measure AI Competitive Visibility: Which Competitors Appear Most Often in AI-Generated Recommendations? (2026)
An independent measurement guide for US businesses. Last reviewed: November 16, 2026.
When someone asks ChatGPT, Gemini, Claude, Perplexity, or Microsoft Copilot to recommend a supplier, your business may appear alongside established rivals—or not appear at all. But which competitors are actually winning visibility? A single screenshot cannot answer that question. A defensible comparison requires consistent questions, repeat observations, clear classifications, and a method that distinguishes simple mentions from positive recommendations.
This guide shows marketing teams how to build a repeatable AI competitive visibility audit, calculate competitor appearance rates, compare recommendations, and interpret changes without mistaking sample results for universal market share. It also explains which tools can help and links to US-based providers listed in our directory.
Quick answer: Create a representative panel of buyer-intent prompts, run them across selected AI assistants under controlled conditions, record every eligible response, mark whether each competitor was mentioned or actively recommended, and calculate platform-specific rates. Repeat on a consistent schedule. A higher rate in the tested panel indicates greater sampled visibility—not a guaranteed preference across all users or queries.
1. What is AI competitive visibility?
AI competitive visibility describes how frequently and in what context a brand appears relative to specified competitors in sampled AI-generated answers. It is an observational research construct, not a standardized ranking factor or an official performance score shared by all AI providers.
For a US software company evaluating competing CRM brands, a useful audit might ask assistants to recommend platforms for a 20-person sales team, compare implementation difficulty, summarize pricing models, or identify alternatives to a particular product. These prompt types reflect different stages of a buying journey. Brand visibility can vary substantially between them.
A sound audit does not assume an assistant has a stable, universal "top ten" list. Responses can depend on the exact prompt, model version, tools and web access, user location, conversation context, date, and generation variability.
2. Four competitive measures that should not be confused
| Metric | Question answered | Suggested denominator |
|---|---|---|
| Competitor Mention Rate | In how many sampled eligible answers does this brand appear? | All eligible answers in the defined prompt panel |
| Competitor Recommendation Rate | In how many sampled eligible answers is this brand affirmatively recommended? | All eligible recommendation-opportunity answers |
| Recommendation Share | What fraction of recorded positive recommendation events belongs to this brand? | All positive recommendation events across the comparison set |
| Citation Share in the sample | What fraction of recorded citations point to this brand's domain? | All relevant citation events across the defined domain set |
A brand may receive a negative mention without a recommendation. An AI answer may recommend a company without linking to its website. A website may be cited as background evidence without its owner being recommended. Keep these events separate.
A fifth useful metric is Top-N Placement Rate: the fraction of recommendation-opportunity answers where the brand appears among the first N named recommendations. Record the order exactly as displayed and report the value as a presentation measure, not a conventional search-engine rank.
3. Formulas for comparing competitors
For any brand b in a panel with N eligible answers:
Mention Rate (%) = 100 × answers mentioning brand b / N.
For recommendation prompts with R eligible answers:
Recommendation Rate (%) = 100 × answers positively recommending brand b / R.
Across all brands, where one answer can recommend more than one brand:
Recommendation Share (%) = 100 × recommendation events for brand b / recommendation events for all tracked brands.
For a defined reference set of domains:
Sample Citation Share (%) = 100 × citation events attributed to brand b's domain / all relevant citation events in the reference set.
Because an answer can name multiple competitors, individual mention rates and recommendation rates do not need to sum to 100%. By contrast, recommendation shares sum to 100% within the defined set of recommendation events. If you limit your audit to four competitors and omit other brands, label the resulting share "share among tracked brands," not market-wide AI share.
4. Worked example: four competitors across 200 sampled answers
Suppose a US B2B software business collects 200 eligible AI answers, including 120 eligible recommendation opportunities. The figures below are fictional teaching data, not actual brand performance.
| Brand | Answers mentioning brand | Mention Rate | Eligible answers recommending brand | Recommendation Rate |
|---|---|---|---|---|
| Your Brand | 70 | 35.0% | 36 | 30.0% |
| Competitor A | 110 | 55.0% | 60 | 50.0% |
| Competitor B | 80 | 40.0% | 42 | 35.0% |
| Competitor C | 50 | 25.0% | 22 | 18.3% |
For example, Your Brand's mention rate is 70 ÷ 200 × 100 = 35.0%. Its recommendation rate is 36 ÷ 120 × 100 = 30.0%. Competitor A appears more often and is recommended more frequently within this panel.
There are 160 total positive recommendation events across the four tracked brands (36 + 60 + 42 + 22). Your Brand's Recommendation Share among tracked brands is 36 ÷ 160 × 100 = 22.5%; Competitor A's is 37.5%, Competitor B's 26.25%, and Competitor C's 13.75%.
Notice that there are more than 120 recommendation events despite only 120 recommendation-opportunity answers. This is entirely possible because an answer can recommend multiple suppliers. Do not silently treat these as unique users, customers, or purchases.
A useful strategic finding would be: Your Brand is mentioned in 35% of the sampled answers but affirmatively recommended in 30% of recommendation opportunities. Next inspect which commercial prompt categories drive that difference; do not immediately conclude that the brand needs more articles or backlinks.
5. Step 1 — Define the US market you want to evaluate
Begin with a precise business scope. Record the country, industry, product category, buyer size, applicable regulations, and purchasing context. A "best marketing platform" query is too vague for a supplier comparison that targets US mid-market businesses.
Write a short research objective, such as: "Measure how frequently our US payroll software appears relative to three named competitors when buyers ask English-language AI assistants for solutions serving companies with 50–500 employees."
Do not include competitors merely because they are famous. Choose substitutes that real buyers would consider, and document why each belongs in the comparison set. Maintain a canonical name and a list of brand aliases; distinguish parent brands, acquired products, and differently named business units.
6. Step 2 — Build a balanced buyer-intent prompt library
Use prompts representing distinct buying decisions rather than variations of the same query. A starting panel might contain 30–40 prompts distributed across these themes:
| Prompt category | Example question | Reason to test |
|---|---|---|
| Category discovery | Which payroll software platforms serve US mid-market businesses? | Broad consideration |
| Recommendation | Recommend payroll software for a 100-person US company | Direct buyer selection |
| Alternatives | What are alternatives to [competitor] for payroll management? | Competitive substitution |
| Requirements | Which providers support multi-state payroll and HR integrations? | Capability fit |
| Comparison | Compare three payroll systems for implementation and support | Side-by-side evaluation |
| Risk and trust | What should buyers verify before choosing payroll software? | Credibility and proof |
Replace these examples with your actual category and needs. Do not inject your brand into every prompt: branded questions test brand recall and factual representation, while unbranded questions are better for measuring discovery. Keep branded and unbranded panels separate.
Store a stable prompt ID, intended audience, buyer stage, market, and reason for inclusion. Avoid changing the prompt list during a baseline period without versioning it.
7. Step 3 — Choose platforms and testing conditions
Include the AI services relevant to your customers: ChatGPT, Google Gemini, Claude, Perplexity, and Microsoft Copilot are common candidates. When relevant, create a separate panel for Google AI Overviews or AI Mode. Gemini Apps and Google AI Overviews are not interchangeable interfaces and should not be collapsed into one metric without disclosure.
Record the date, platform, model or product version when available, whether web search was enabled, account and localization settings, and whether the test occurred in a fresh conversation. For commercial monitoring tools, ask which settings the vendor controls and how repeated prompts are sampled.
For an initial manageable baseline, 30 prompts × 5 platforms × 2 repeat observations yields 300 responses. This is an operational starting point, not a statistically representative estimate of all AI users. If your business requires confidence intervals, design the sampling strategy with a qualified analyst; repeated responses to similar prompts are not necessarily independent observations.
8. Step 4 — Store the full answer and evidence
Create a row for every response and retain the full text or approved export, not just a yes/no label. Store the URL citations, the displayed order of recommendations, and an evidence pointer or screenshot where permitted. If the assistant refuses, gives no substantive answer, or lacks the necessary browsing capability, flag that outcome rather than classifying it as a normal absence.
Suggested fields:
run_id, prompt_id, platform, observed_at_utc, market, query_type, model_version, web_enabled, response_status, brand, mention_flag, recommendation_flag, first_position, sentiment, cited_domain, cited_url, accuracy_status, reviewer, evidence_reference
One response can yield several brand-level rows. Also maintain one response-level table keyed by run_id, so counting eligible answers is straightforward and duplicate imports do not inflate the denominator.
9. Step 5 — Apply explicit mention and recommendation rules
A mention is an unambiguous reference to the brand or an approved alias in the answer. A competitor appearing only in a cited URL does not automatically count as a textual brand mention. A generic product description that could describe several providers does not count without evidence.
A recommendation is an affirmative selection, suggestion, or inclusion in a list presented as suitable to the user's request. Record whether it is conditional: "Consider Brand X if you need integrations" is still a recommendation if the condition matches the prompt. "Brand X is too expensive for this use case" is a mention but not a recommendation.
For borderline cases, store uncertain and review manually. Label sentiment and brand accuracy separately; praise can be inaccurate, and a factual negative comment can be fully supported. For quality control, have two reviewers independently classify a subset of responses, record disagreements, refine the rubric, and retain the agreed labeling rules.
10. Step 6 — Calculate results separately by platform and intent
A single pooled percentage may hide important differences. Calculate mention and recommendation rates for each combination of platform and prompt category before combining results. If ChatGPT received 100 sampled answers but Claude received 20, an unweighted average of their percentages would not describe the pooled sample.
For an overall result across observed answers, sum events and denominators across strata:
Pooled Mention Rate = 100 × total mentioning responses / total eligible responses.
If your intention is to represent five platforms equally, regardless of sample size, report an equal-platform weighted score instead and clearly label the chosen weights. These are different estimands. Neither is a measure of real-world platform usage unless the sample and weights are based on reliable usage data.
Also segment by buyer intent, brand familiarity, industry, state, and product requirement when sample sizes allow. A business might perform well on broad informational prompts but poorly in high-intent comparisons—the commercially relevant gap.
11. Step 7 — Measure presentation order and citation evidence
For answers containing ranked or ordered lists, capture whether a brand is first, in the top three, or lower down. Use Top-3 Placement Rate as a descriptive measure in ordered recommendation answers. Avoid interpreting the order as a stable search-engine ranking; many answers do not have ordered lists and the assistant's output can change.
Collect citation URLs separately. A cited competitor domain might indicate source use, not a recommendation. Conversely, an assistant may recommend a well-known provider without linking to its site. When auditing citation evidence, check that linked sources actually support the claims and that the pages remain accessible.
The distinction is important for software dashboards: a high citation share can coexist with a low recommendation rate, and a high recommendation rate can coexist with limited direct website citations.
12. Step 8 — Build a competitor opportunity matrix
After identifying underperforming prompts, group gaps by business reason:
| Observed pattern | What to investigate | Possible next action |
|---|---|---|
| Rivals recommended more often for a specific feature | Missing or unclear product evidence | Improve truthful feature and documentation pages |
| Competitor citations dominate technical questions | Better explanatory material or third-party documentation | Publish useful technical guides and original evidence |
| Your company appears but is described inaccurately | Old pricing, outdated positioning, inconsistent sources | Correct canonical information and request updates where appropriate |
| Brand weak in a US region or industry | Weak local or vertical proof | Create accurate industry examples and location-relevant evidence |
| Recommendation rates fluctuate heavily | Small sample or model variation | Increase observations and repeat the fixed panel |
These are hypotheses for investigation, not proof of why AI systems selected a competitor. Changes in model behavior, retrieval sources, and content freshness can all affect observations.
13. Step 9 — Compare with independent business signals
AI competitive visibility is most useful when connected to commercial outcomes. Review branded search demand, AI referral sessions where attributable, qualified leads, sales discovery notes, and customer-reported discovery channels. Do not claim that a change in AI recommendation rate caused a revenue change without appropriate attribution evidence.
Search Console's generative AI reports provide first-party insights for Google Search experiences such as AI Overviews and AI Mode, but they are not a comprehensive competitor recommendation log. Bing Webmaster Tools AI Performance provides aggregated citation activity for eligible sites in supported Microsoft experiences; its Citation Share measures relative citation presence for grounding queries, not named competitor recommendations. See the Google Search Console announcement and Bing AI Performance documentation.
14. Step 10 — Create a consistent reporting dashboard
For each platform and prompt group, display:
- Your Brand's Mention Rate and Recommendation Rate
- Competitor A, B, and C rates using the same denominators
- Recommendation Share among tracked brands
- Top-3 Placement Rate on eligible ordered answers
- Citation Share for the defined domain set
- Data volume, excluded responses, and coverage period
- Period-over-period changes using the same prompt panel
Put the methodology and sampling notes next to the charts. A percentage without the sample size and response eligibility rules is not enough to interpret performance.
15. Step 11 — Repeat the audit without losing comparability
Keep a locked core prompt panel for longitudinal monitoring. You can add new prompts for emerging topics, but track them in a separate expansion panel so the original baseline remains comparable.
Repeat on a cadence that matches your business—weekly for fast-moving product categories or monthly for broader market monitoring. Store prompt text, execution settings, observed dates, and model versions wherever available. Treat dramatic movement in small samples cautiously; inspect the underlying responses before deciding the brand has gained or lost meaningful visibility.
If an AI platform changes its retrieval or output behavior, annotate the report and consider establishing a new baseline. For high-stakes decisions, use sufficiently large and varied samples, review measurement uncertainty, and avoid causal claims from before-and-after comparisons alone.
16. Step 12 — Turn competitive gaps into a 30-day improvement plan
Days 1–7: Scope and baseline. Select three genuine competitors, define the target US audience, build the prompt panel, and audit initial results across the chosen platforms. Record both mentions and recommendations.
Days 8–14: Evidence review. Identify the prompt categories where your brand is absent or under-recommended. Review factual claims and sources. Compare product pages, FAQs, case studies, third-party reviews, and documented features with competitors' publicly available materials.
Days 15–21: Implement improvements. Fix inaccurate or outdated information; strengthen genuinely useful product and comparison explanations; improve crawlability and site architecture when technical issues exist; publish authentic evidence rather than generic AI-generated pages.
Days 22–30: Re-test and report. Run the same core prompt panel with the same settings. Compare observed rates, summarize limitations, and create a backlog of further work. Avoid promising a specific improvement or attributing short-term fluctuations entirely to the updates.
17. Spreadsheet-ready monitoring worksheet
Use one row per brand per response and maintain an independent response ID table. For an initial CSV, the following columns can be used:
| Field | Example |
|---|---|
| run_id | 2026-11-16-CG-001 |
| prompt_id | REC-001 |
| platform | ChatGPT |
| observed_at_utc | 2026-11-16T14:00:00Z |
| buyer_intent | Recommendation |
| brand | Competitor A |
| mentioned | 1 |
| recommended | 1 |
| displayed_position | 2 |
| citation_url | example URL if cited |
| reviewer | Analyst 1 |
Use 1 for observed presence and 0 for absence after applying the codebook. Store missing, refused, and uncertain results explicitly instead of quietly treating them as zero. Preserve the original answer evidence and document all exclusion rules.
18. Selecting AI competitive visibility software
Manual audits are useful for learning the definitions and checking unusual answers. As the panel grows, specialist tools may help schedule prompt runs, compare competitors, and visualize trends. Review each product's sampling methodology and data exports before buying.
US-based platforms listed in our AI Visibility Platforms directory include:
- Profound — AI search intelligence and brand visibility analytics.
- Evertune — GEO research and competitive monitoring.
- Scrunch AI — AI visibility and citation monitoring, plus agent experience.
- Brandlight — enterprise brand representation and reputation intelligence.
- Conductor — enterprise SEO and AI search performance workflows.
- seoClarity — AI search and enterprise SEO analytics.
For managed strategy and implementation, see our GEO & AEO Agencies directory, including WebFX, Omniscient Digital, iPullRank, and First Page Sage.
Vendor feature availability can change. Confirm platform coverage, sampling limits, data ownership, exports, and pricing directly before committing. These links are independent directory references, not endorsements or paid rankings.
19. Common measurement mistakes
Confusing mentions with endorsements. An assistant can mention a competitor critically or as an example without recommending it. Apply separate classification flags.
Using a brand-heavy prompt panel. If most prompts include your brand name, the resulting visibility rate cannot represent unbranded category discovery.
Treating mention rates as additive. Multiple brands may occur in one answer, so their mention rates can sum well above 100%.
Comparing dissimilar samples. A competitor's 40% on one set of prompts is not directly comparable to your 30% on a different prompt set.
Overinterpreting one answer. AI-generated results can vary between runs and over time. Repeat the panel and inspect sample sizes.
Assuming citations equal recommendations. A citation can be background evidence. Only explicit recommended brands qualify for the recommendation numerator.
Inventing causality. A content update followed by a higher rate does not prove the update caused the change.
Ignoring ambiguous aliases. Common words and product names can produce false positives. Maintain a reviewable alias list.
20. Frequently asked questions
What is a good AI competitor mention rate?
There is no universal threshold. A meaningful benchmark depends on category, buyer intent, competitors, platform mix, and sampling. Compare with your own baseline and direct rivals measured under the same conditions.
Is AI competitive visibility the same as AI Share of Voice?
Not exactly. Competitive visibility is a broad analysis of appearances and recommendations. AI Share of Voice usually denotes a specifically defined proportion of total brand presence or other events. See our AI Share of Voice calculation guide.
Can several brands be recommended in the same answer?
Yes. Each brand can register a recommendation event, so recommendation rates across brands can total more than 100%. Recommendation Share divides a brand's events by all events in the tracked comparison set.
Can I compare ChatGPT, Gemini, Claude, Perplexity, and Copilot directly?
You can use a consistent prompt panel and labeling rubric, but different assistants have different capabilities, retrieval systems, and user experiences. Report platform-level results first. See our platform comparison guide.
Does Google Search Console tell me which competing brands Gemini recommends?
No. Google's Search Console generative AI reporting concerns your site's visibility in supported Google Search experiences; it does not provide a universal brand recommendation or named competitor tracker for Gemini Apps.
Does Bing Webmaster Tools' Citation Share identify competing domains?
No. Microsoft's documentation says Citation Share measures relative citation presence for a grounding query without exposing the competing domain names in the remaining citation space.
How often should I refresh my panel?
Monthly is a practical starting point for many teams; weekly may be useful for fast-changing categories. Consistency matters more than producing an elaborate dashboard once.
Can we guarantee a higher ranking in AI answers?
No. There is no universal persistent ranking in conversational answers. Credible content and technical improvements may improve discoverability, but no provider can guarantee AI recommendations.
Should we count every mention as positive sentiment?
No. Record the existence of a mention and its tone separately. For methodology, see our AI Brand Sentiment guide.
What if AI answers contain incorrect competitor information?
Track factual accuracy independently and inspect the evidence before taking action. See our AI Brand Accuracy guide.
21. Conclusion: use consistent observations, not anecdotal screenshots
AI-generated recommendations can be useful competitive intelligence, but they require disciplined measurement. Define your market, sample real buyer questions, separate mentions from recommendations, make the denominator visible, audit source evidence, and repeat the same panel over time. Use competitor gaps to guide factual improvements and commercial research—not to claim secret knowledge of how an assistant ranks businesses.
Explore verified US-based providers in the AI Visibility Directory to compare specialist monitoring software and agencies that can support this work.
Sources and further reading
- Microsoft — AI Performance in Bing Webmaster Tools (citation metrics, grounding queries, and reporting limitations).
- Microsoft — New AI Visibility Insights: Citation Share, Topics, Intents, Compare (June 2026).
- Google Search Central — Generative AI performance reports in Search Console (June 2026).
- Google Search Central — AI features and your website (official technical guidance).
Editorial disclosure: The examples and numbers are fictional. This article is an independent educational guide; it does not present a validated ranking of providers or guarantee AI-generated recommendations.