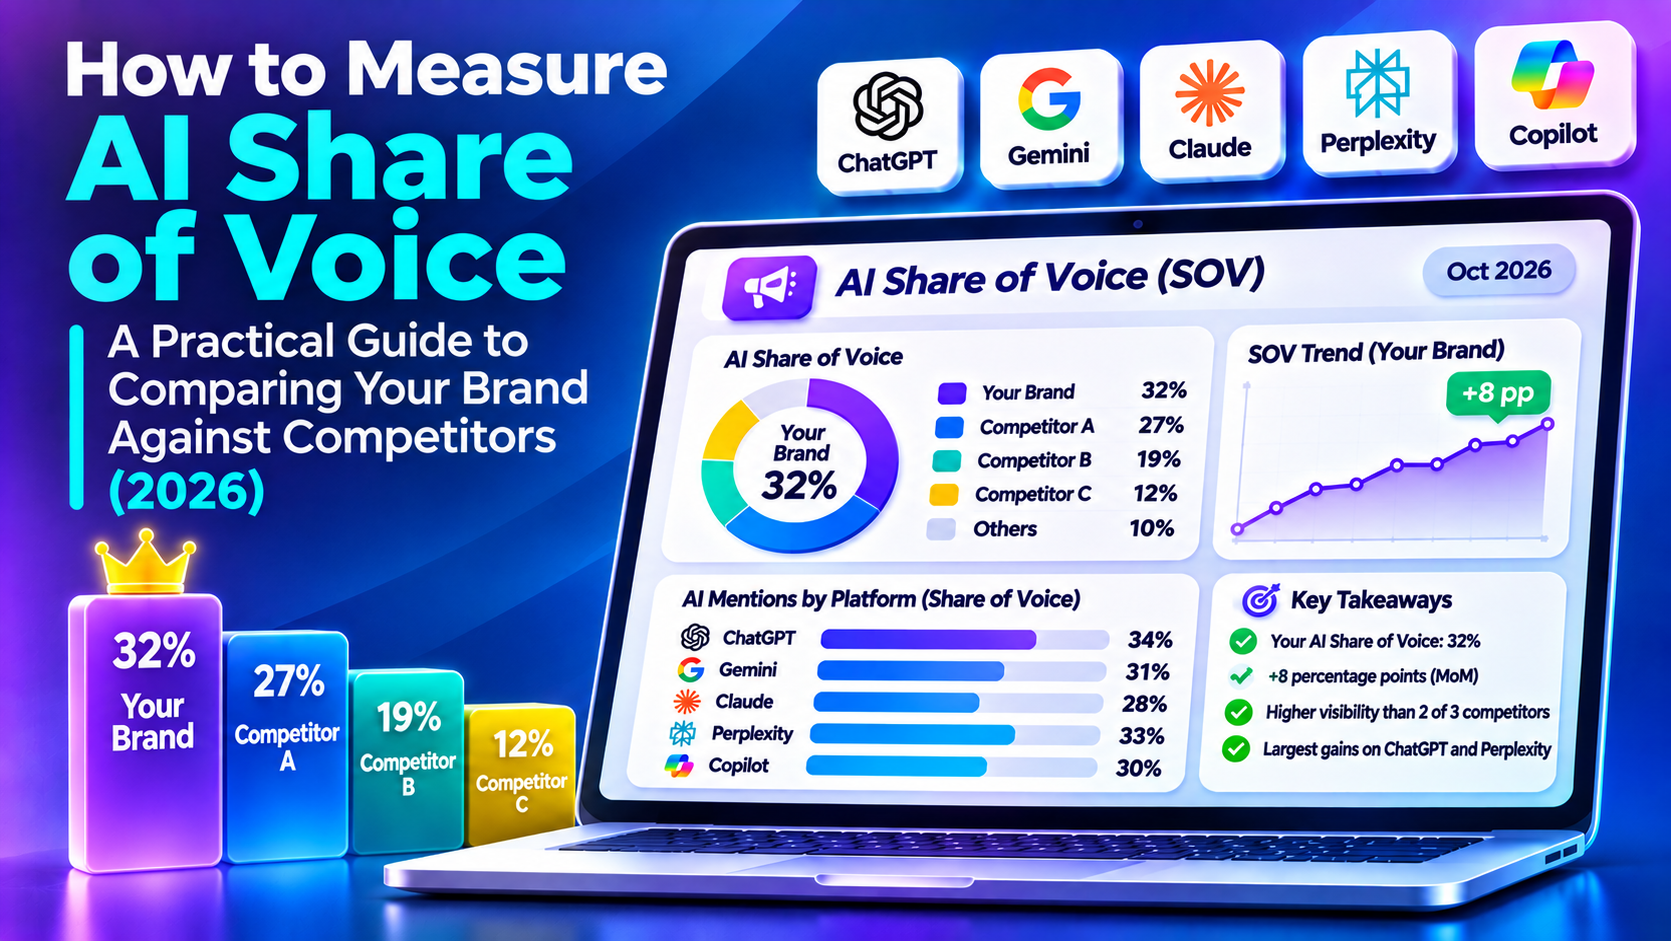
How to Measure AI Share of Voice: A Practical Guide to Comparing Your Brand Against Competitors (2026)
AI Share of Voice (AI SOV) describes how much of a defined set of AI-generated brand mentions belongs to your company rather than to competitors. It offers a practical way to ask: When customers ask AI assistants about our market, how visible are we compared with alternatives?
The metric is useful, but there is no universally standardized formula across AI visibility tools. Some products count every occurrence of a name; others count one brand presence per answer, restrict the denominator to tracked competitors, or apply position and citation weights. A percentage without its methodology is easy to misinterpret.
This 2026 guide shows US businesses how to define a defensible AI Share of Voice metric, collect evidence across ChatGPT, Google Gemini, Claude, Perplexity, and Microsoft Copilot, calculate a baseline, and turn changes into concrete decisions.
What Is AI Share of Voice?
AI Share of Voice is a relative visibility metric for a specific set of AI-generated answers. It estimates the proportion of observed brand presence attributable to one business within the selected category, prompts, platforms, geography, and time window.
For example, a buyer might ask, “What are the most suitable payroll platforms for a 40-person US company?” If an assistant names five vendors, the answer supplies evidence of which brands are visible for that particular question. Repeating a consistent set of questions helps reveal patterns; it does not establish a permanent universal ranking.
AI SOV should always be described as sample-based. AI answers can vary by model, retrieval access, user context, location, time, and prompt phrasing.
AI Share of Voice vs Mention Rate vs Citation Share
These three measurements answer different questions.
| Metric | Question answered | Example denominator |
|---|---|---|
| AI Mention Rate | In what percentage of sampled answers does our brand appear? | All eligible answers |
| AI Share of Voice | What proportion of observed brand mentions belongs to our brand? | Brand mentions across the chosen brand universe |
| AI Citation Share | What proportion of cited source links/domains belongs to our website? | All observed citations in the defined scope |
| AI Recommendation Rate | In what percentage of answers is our brand affirmatively recommended? | All eligible recommendation-eligible answers |
A business can have a 35% mention rate and a 23.3% share of voice at the same time. The first describes coverage of answers; the second describes relative competition within answers. Citation share is not interchangeable with either one: an answer can mention a brand while linking to an independent review site.
For more on the first and fourth metrics, read AI Brand Mention Rate vs AI Recommendation Rate.
Step 1: Choose a Calculation Rule Before Collecting Results
A simple method suitable for spreadsheet tracking is answer-level, distinct-brand Share of Voice:
AI SOV (%) = (number of sampled answers that mention your brand ÷ sum of brand-present counts for every included brand across those answers) × 100.
Count each named brand at most once per answer. If one response names your company three times, that response contributes one brand presence to the numerator. If it also names two competitors, those contribute one presence each to the denominator.
This is a share of observed brand presences, not a share of unique answers. The denominator can exceed the number of responses because one answer may name several companies.
Other defensible methodologies exist:
- Occurrence-based SOV: Count every actual occurrence of each brand name, including repeated mentions within one answer.
- Tracked-competitor SOV: Include only a predefined set of competitors. Always label this tracked-set SOV, because excluded brands do not appear in its denominator.
- All-detected-brand SOV: Include every qualifying brand found in the captured answers. This can better reflect fragmentation but requires consistent entity recognition and disambiguation.
- Weighted SOV: Give different weights to early mentions, recommendations, prompts, or sources. Publish the weights and avoid comparing the result directly with an unweighted percentage.
Conductor distinguishes mention-based and citation-based Share of Voice. Profound publishes its own share-of-voice definition. This is why procurement teams should ask vendors for the exact formula, not just a dashboard screenshot.
Step 2: Define the Competitive Market
Begin with the problem the buyer wants solved, not a generic list of famous companies. A US payroll provider might compare itself against providers buyers routinely evaluate for payroll and HR needs, rather than the entire software industry.
Define the following before running any analysis:
- Buyer group: US small businesses, enterprise IT teams, healthcare practices, or another specific audience.
- Product category: What is being purchased or researched?
- Geography and language: US English, or specified regional variants.
- Tracked brands: Your brand, direct rivals, and a clear process for identifying newly mentioned competitors.
- Brand aliases: Official names, abbreviations, product brands, and common spelling variations.
- Exclusions: Ambiguous words, generic category terms, and companies that should not be counted as competitors.
Brand-entity cleanup matters. A response saying “Apple” could mean a technology company or a fruit in another context. Similarly, names such as “Monday” require contextual verification rather than blind string matching.
Step 3: Build a Buyer-Intent Prompt Library
For an initial pilot, choose 30–50 prompts based on realistic customer research. Do not write only prompts that contain your company's name; that would inflate your measured visibility.
Use a balanced selection of intents:
| Intent | Example prompt for a US buyer |
|---|---|
| Category discovery | What are reputable payroll systems for a small US company? |
| Needs-based research | Which payroll tools support multi-state tax compliance? |
| Budget research | Which payroll platforms fit a 35-employee business on a limited budget? |
| Comparison | Compare payroll software for an expanding US services firm. |
| Industry fit | What payroll tools are suitable for US restaurants? |
| Implementation | Which providers offer onboarding assistance and employee self-service? |
The prompts above are illustrative, not evidence that any brand performs well. Assign each prompt an ID, topic, intent, US locale, and business priority. Save the exact prompt text, including punctuation. Change control is essential: adding new prompts to the dataset without separately reporting the change can create false trends.
Step 4: Sample Multiple AI Assistants
Start with five platforms where relevant to your audience:
- ChatGPT: Capture results with the search or browsing setting documented.
- Google Gemini: Record the exact Gemini product experience being tested.
- Claude: Distinguish general assistant answers from answers using web search.
- Perplexity: Retain cited sources alongside the response.
- Microsoft Copilot: Document the consumer or Bing-integrated experience, since environments differ.
Run identical prompts against each platform at a defined interval. Record model/version where visible, date, region, access tier, and whether the response used web retrieval. A prompt yielding no brand recommendation still belongs in the denominator for mention rate, though it adds zero to the brand-presence denominator for SOV.
For a manageable pilot, 40 prompts × 5 assistants × 1 run produces 200 sampled responses. For stronger reliability, repeat prompts in separate runs and report variation instead of presenting a one-off snapshot as a market fact.
Step 5: Collect Structured Response Data
Use one row per brand–answer observation, or store one row per answer with an associated brand-presence table. A practical schema is:
| Field | What to store |
|---|---|
| run_id | Unique run identifier |
| prompt_id | Stable buyer-question identifier |
| platform | ChatGPT, Gemini, Claude, Perplexity, or Copilot |
| observed_at | Date and time |
| country_language | For example, US / English |
| retrieval_mode | Web search enabled, disabled, or unknown |
| response_text | Full captured response, subject to platform terms |
| brand_entity | Canonical company identity |
| mentioned | 1 if included at least once, otherwise 0 |
| recommended | 1 if the defined recommendation rule applies |
| cited_domain | The linked source domain, if available |
| evidence_excerpt | Short text explaining the classification |
Keep original responses or stable evidence references for auditability. If collecting data via an API or third-party tool, follow applicable platform terms and avoid assuming the output is identical to a consumer chat interface.
Step 6: Calculate AI Share of Voice — Worked Example
Imagine that a US SaaS company analyzes 200 AI responses in one month. Across those responses it detects the following distinct brand presences:
| Brand | Answers mentioning brand | Mention Rate (out of 200) | Share of Voice (out of 300 brand presences) |
|---|---|---|---|
| Your Brand | 70 | 35.0% | 23.3% |
| Competitor A | 95 | 47.5% | 31.7% |
| Competitor B | 55 | 27.5% | 18.3% |
| Competitor C | 30 | 15.0% | 10.0% |
| Other Brands | 50 | 25.0%* | 16.7% |
| Total brand presences | 300 | Not additive | 100.0% |
*“Other Brands” combines multiple entities. Its 25% figure is a count of their combined distinct-brand presences divided by 200 answers, not a single-brand mention rate; some answers may contain more than one other brand. Report individual entities separately when possible.
The arithmetic for Your Brand is:
AI SOV = 70 ÷ 300 × 100 = 23.33%.
AI Mention Rate = 70 ÷ 200 × 100 = 35%.
The first number means your brand earned about 23% of all observed distinct-brand presences in the sample. The second means it appeared in 35% of the sampled answers. Neither number says that 23% or 35% of actual US shoppers saw your brand, because these prompts were a researcher-selected sample, not a panel of observed customer conversations.
Why percentages change when the competitor set changes
Suppose you remove “Other Brands” from the denominator. Your tracked-set SOV becomes 70 ÷ 250 = 28%, even though your brand appeared exactly as often. Nothing improved in the market; only the measurement definition changed.
The denominator and competitor universe must remain stable for trend reporting, or shifts must be disclosed and historical figures recalculated.
Step 7: Break Results Down by AI Platform
A single combined percentage can conceal important differences. In the same 200-response example, suppose your brand appears in 10 ChatGPT answers, 14 Gemini answers, 13 Claude answers, 18 Perplexity answers, and 15 Copilot answers, with 40 responses per platform.
| Platform | Your brand present | Answers tested | Mention Rate |
|---|---|---|---|
| ChatGPT | 10 | 40 | 25.0% |
| Gemini | 14 | 40 | 35.0% |
| Claude | 13 | 40 | 32.5% |
| Perplexity | 18 | 40 | 45.0% |
| Copilot | 15 | 40 | 37.5% |
| Overall | 70 | 200 | 35.0% |
These are illustrative data. To compute per-platform SOV, you would also need the total number of brand presences detected on each platform; the table above provides mention rate only. Do not label it SOV.
Report by prompt type as well: educational questions, high-intent purchase queries, branded comparisons, and local US buying scenarios may have very different outcomes.
Step 8: Separate Being Named, Recommended, and Cited
A brand might appear in an answer as a cautionary example, as one option among many, or as the assistant's explicit recommendation. Treating those outcomes equally overstates commercial significance.
Use separate fields:
- Mention: The canonical brand is named in the answer.
- Recommendation: The answer affirmatively proposes the company as a suitable choice under a published labeling rule.
- Citation: An identifiable source link points to the company's owned domain or another relevant source.
- Brand accuracy: Factual claims match an approved source of truth.
- Sentiment/context: The framing is positive, neutral, mixed, or negative according to a documented rubric.
A citation to a competitor's website can support an answer that mentions your company. That is another reason why citation share and brand-mention share must remain distinct metrics.
Bing Webmaster Tools introduced AI Performance reporting in 2026 and subsequently added Citation Share for particular grounding queries. Microsoft's metric describes a site's share of citations within that query scope; it is not a universal brand recommendation score.
Step 9: Compare Trends Responsibly
Establish a baseline, then repeat the same prompt set every two or four weeks. Record:
- Absolute SOV change in percentage points, such as 23.3% to 26.3% = +3.0 points.
- Relative change, such as +3 ÷ 23.3 = approximately +12.9%.
- Mention rate changes and recommendation rate changes separately.
- Differences by platform, intent category, and competitor.
- Newly discovered competitors, changed prompt sets, model changes, or new retrieval behavior.
Do not infer causation from correlation. If SOV rises after publishing new content, that is a reason to investigate, not proof the content caused the lift.
When results fluctuate sharply, review raw responses and increase repeat sampling before making strategic decisions.
Step 10: Build a Monthly AI Share of Voice Dashboard
A practical US business dashboard can use these fields:
| KPI | Baseline | Current | Interpretation |
|---|---|---|---|
| AI Share of Voice | 23.3% | 26.3% | Relative brand presence gained 3.0 points |
| AI Mention Rate | 35% | 39% | Brand appeared in more sampled answers |
| AI Recommendation Rate | 16% | 18% | Recommendation coverage improved |
| Owned-Domain Citation Rate | 9% | 11% | More sampled answers cited owned pages |
| Brand Accuracy | 92% | 94% | Fewer reviewed factual errors |
| AI Referral Conversions | 8 | 11 | More tracked downstream conversions |
All figures above are fictional. Include raw sample sizes, the platform mix, the time period, a link to the methodology, and uncertainty notes beneath every report. Referral attribution will be incomplete when AI interfaces do not pass recognizable referring URLs.
Step 11: Use the Results to Find Commercial Opportunities
AI SOV becomes most useful when attached to buyer intent rather than treated as a vanity metric.
Suppose a SaaS business finds that it is mentioned frequently in “What is payroll software?” answers but rarely in “best payroll service for a 50-person US manufacturing company” answers. The opportunity is likely not another generic definition article. The team should investigate whether it has credible industry-specific materials, detailed product capabilities, current pricing information, and independent supporting evidence.
Similarly, if competitors gain citations on detailed comparison queries, review the referenced source pages before commissioning new content. Identify whether those sources offer data, firsthand demonstrations, original research, or clearer product descriptions that your site currently lacks.
Use a small number of hypotheses with measurable outcomes. Avoid buying fake reviews, creating manufactured testimonials, or publishing unsupported “best” claims to influence AI answers.
Step 12: Decide Whether You Need an AI Visibility Platform
For a small prompt panel, a spreadsheet and a consistent manual evaluation method can be sufficient. Automation becomes useful when the number of prompts, competing brands, platforms, or reporting periods grows.
When evaluating commercial software, ask vendors:
- What exactly counts as a brand mention?
- Is SOV based on total occurrences or unique brand presence per answer?
- Does the denominator include all detected brands or only tracked competitors?
- Are prompts weighted by topic, search volume, intent, or estimated value?
- How are aliases, subsidiaries, and similarly named brands handled?
- Can we inspect raw answers, timestamps, citations, and prompt IDs?
- How are regions, model versions, search modes, and reruns recorded?
- Does the tool distinguish mentions, recommendations, and citations?
- Can we export the underlying observations and reproduce the number?
- How are changes to tracking methodology recorded?
The AI Visibility Software category in our independent directory includes US-based providers such as Profound, Evertune, Scrunch AI, Brandlight, Conductor, and seoClarity.
These are directory entries, not a ranking or an assertion that every provider uses the same definition of SOV. Review product documentation and request a sample report before purchasing.
A Practical 30-Day AI SOV Implementation Plan
Days 1–7: Define the scope
Document your buyer segment, relevant categories, target prompts, five selected platforms (or a smaller set matching your customers), competing brands, and the exact calculation rule. Create a brand alias list and test it against a few sample answers.
Days 8–14: Collect a baseline
Run the prompt panel, save raw answers, label each brand presence, and conduct a manual quality check on ambiguous mentions. Calculate mention rate and SOV separately. Keep a log of any failed or unanswerable runs.
Days 15–21: Investigate gaps
Break results down by assistant, purchase intent, and competitor. Read underlying responses to find missing buyer questions, inaccurate descriptions, weak citations, and content gaps. Prioritize commercially important problems.
Days 22–30: Implement and report
Improve the most useful pages and business details, update relevant third-party information through legitimate channels, and document what changed. Set the next measurement date and issue a dashboard with the frozen baseline and methodological notes.
Common AI Share of Voice Measurement Mistakes
Comparing different tools as if they use identical formulas. Weighted outputs, occurrence counts, and tracked-set percentages can differ sharply.
Reporting mention rate as SOV. A brand's percentage of answers is not the same as its share of all brand presences.
Using branded prompts only. Questions containing your company name mostly measure whether an assistant recognizes a brand already supplied in the question.
Omitting unexpected competitors. Excluding brands that appear in the answers may artificially increase tracked-set SOV.
Ignoring repeated-run variation. One answer is not a stable population estimate.
Conflating brand mentions with website citations. AI systems may reference third-party websites while discussing your product.
Promising guaranteed improvements. Search systems change, and no marketing agency can reliably guarantee that a generative assistant will recommend a particular company.
Frequently Asked Questions
What is a good AI Share of Voice percentage?
There is no universal benchmark. A 15% share could be excellent in a fragmented industry and weak in a tightly concentrated category. Compare against a stable baseline and appropriate competitors rather than a blanket target.
Can two brands each have more than a 50% AI mention rate?
Yes. A response can name multiple brands, so mention rates across brands need not total 100%. Under the simple share-of-brand-presences model, SOV figures across all included brands do total 100%, subject to rounding.
Does AI Share of Voice measure actual customer exposure?
Not necessarily. A curated prompt sample estimates visibility for those questions. It does not reveal the full volume of real customer prompts unless supported by separate representative demand data.
Should every AI platform receive equal weight?
Equal weighting is transparent for a pilot. Business-specific weighting can be useful if grounded in actual customer usage and disclosed clearly. Do not silently change weights between reporting periods.
Does a higher SOV guarantee more leads?
No. AI mentions may be irrelevant, negative, or unrelated to high-intent questions. Track conversions and qualified buyer behavior alongside visibility metrics.
Can a business measure AI SOV without buying software?
Yes. A documented prompt panel, manual response capture, consistent entity labeling, and a spreadsheet can produce an auditable initial sample. Larger programs benefit from automated collection and quality control.
How is citation share different?
Citation share allocates a proportion of source links or citations to a website or domain. It measures reference presence rather than the share of brands named in text. Microsoft's Bing AI Performance has a query-scoped Citation Share metric.
How often should AI SOV be reviewed?
A monthly review is practical for many small businesses. More frequent sampling may be useful during product launches or major campaigns, provided each reporting window is large and consistent enough to interpret.
Conclusion: Measure Competitors, Not Just Mentions
AI Share of Voice can show whether your brand is gaining relative visibility in AI-generated answers, but its usefulness depends on clear definitions, repeatable samples, and honest interpretation.
Start by freezing a set of buyer questions and competitors, measure brand presence consistently, disclose the denominator, and report mention rates, recommendations, and citations separately. Then use the underlying responses to prioritize improvements that are relevant to potential customers.
Explore US AI Visibility software providers and GEO & AEO agencies in the AI Visibility Directory to compare relevant solutions.
Sources and Further Reading
- Profound: Answer Engine Insights — Share of Voice
- Conductor: AI Share of Voice Benchmarking
- Microsoft Bing: AI Performance in Bing Webmaster Tools
- Microsoft Bing: Citation Share and AI Visibility Insights
- Google Search Central: AI Features and Your Website
Editorial disclosure: This is an independent educational guide. The software providers linked above are directory listings, not sponsored endorsements. All numerical examples are fictional and provided solely to demonstrate measurement methods. Last reviewed: November 15, 2026.